Releasing "Chunk Scatter", an HTTP chunked encoding analysis tool
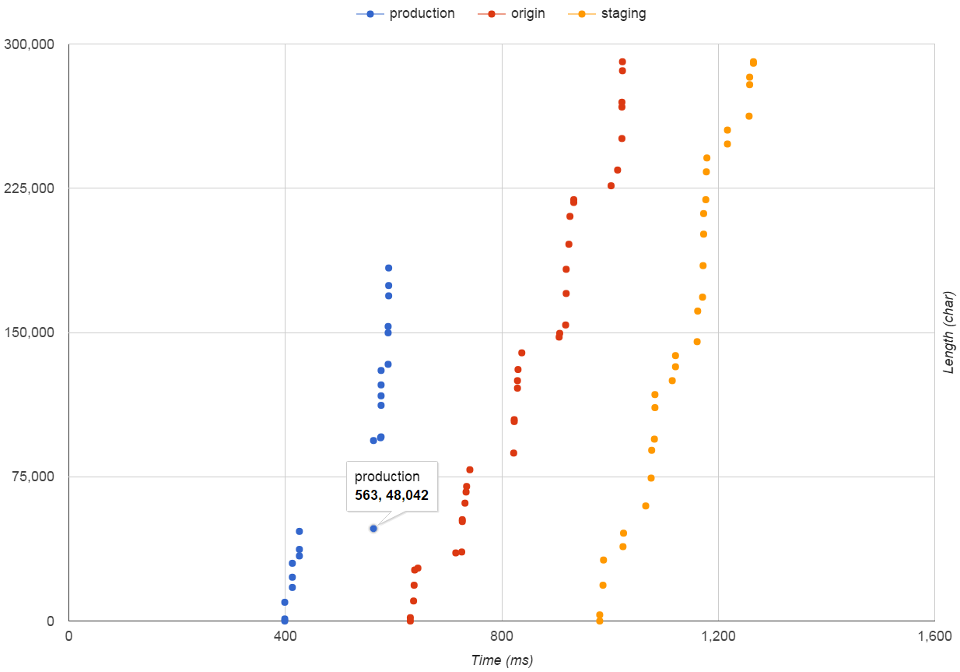
Update: I presented a talk about this tool at the 2016 Reversim Summit. Slides can be found here.
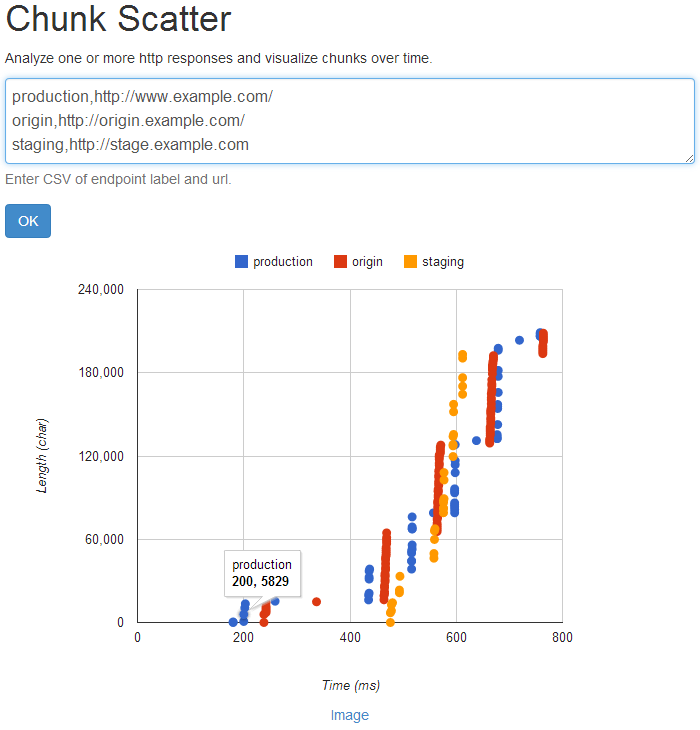
"Chunk Scatter" (github, demo) is a simple tool I wrote for analyzing HTTP responses that use chunked encoding. It plots each chunk on a scatter graph to help visualize when each chunk was received by the client.
By understanding exactly when and what your server is transmitting, you can optimize server flushing for improved performance. Here's a screenshot:
Chunked response and better perceived performance
Let's back up and examine why we would want to make sure our server is sending chunks as early as possible. In his book "High Performance Browser Networking" Ilya Grigorik explains why using HTTP flushing can improve performance.
The HTML document is parsed incrementally by the browser, which means that the server can and should flush available document markup as frequently as possible. This enables the client to discover and begin fetching critical resources as soon as possible.
This is especially true of the <head> portion of the HTML document which declares the stylesheets the page needs. The sooner the browser knows which stylesheets to request, the sooner it can download them and start building the CSSOM, which means the first paint will happen sooner as well.
Difference from other tools
Chrome DevTools, Webpagetest.org, and several other tools can be used to create a timeline visualization of the requests made by the browser (resource waterfall). They can also break down each request to show how long it took for the actual response to begin. This is known as 'Time To First Byte' and it's an important web performance optimization metric.
But what these tools don't show you is what arrived in the first chunk, and in any other chunks until the end of the response.

Fiddler can be set to show the size and content of each chunk if you turn on the "Chunked Transfer-Encoding" Transformer, but it doesn't tell you when each chunk arrived.
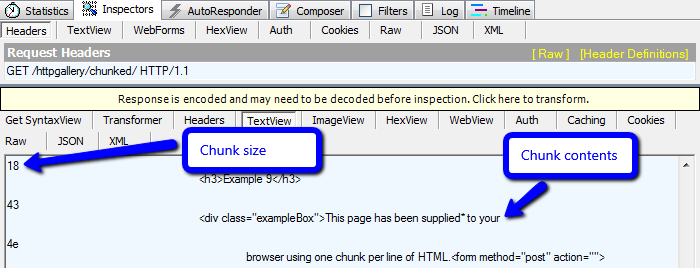
Consider a scenario in which the server responds quickly and sends out the response headers and the very beginning of the HTML document without the stylesheet declarations. Then assume it buffers for a very long time, and then sends out the remaining chunks in quick succession. This would be hard to pinpoint with the existing tools, and that's why I felt there's a need for a tool like Chunk Scatter.
How to use it
To use Chunk Scatter simply enter one or more URLs into the textbox (separated by a new line) and click 'OK.'
The tool lets you visualize several endpoints together in order to compare the same page across different environments and configurations, or just to see how you stack up against the competition.
You can define an alias for each endpoint by adding it before the URL with a comma between them.
Hover over any point and get a tooltip showing when the chunk was received and the response length at that time.
Interpreting results and making them actionable
It's important to note that the tool is geared primarily towards endpoints that return HTML, so it decodes the response as UTF8. The y-axis represents the accumulated length of the response in terms of the number of characters.
The x-axis is simply the time in milliseconds since the request started.
Just by looking at the generated scatter graph you can get a good sense of how your server is responding. You can see if it is firing chunks at steady intervals, or buffering for a long time and then firing them all at once.
A more advanced use-case would be making sure that a specific section of the HTML document (e.g. stylesheet reference) is indeed served early. With a little bit of extra work, you can use Chunk Scatter to find out what chunk contained that section, and when was it received by the client.
Let's see how this can be accomplished. We'll focus on the last <link type="text/css" /> tag in an HTML document. Use your browser or Fiddler to save the HTML document locally and open it up with a text editor like Notepad++. Find the last stylesheet tag and make note of the length of the document up to that point. Here's an example:
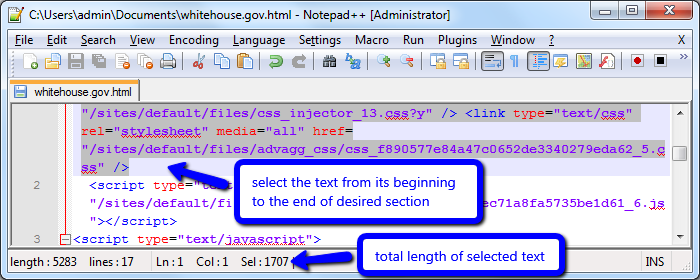
Now enter the server endpoint URL into Chunk Scatter and click 'OK.' Find the lowest point in the resulting graph where the y-axis value is greater than the marked length. That is the chunk that we were looking for. Check its x-axis value and make sure it was served early.
Try it yourself
You can try Chunk Scatter here, and grab the source code on github. Feedback and ideas on how to make it better are welcome. Feel free to tweet at me.

