Slaying God-Classes with "AST Scout", a code structure visualization tool
A few months ago I worked on a legacy Typescript project where having Class files with more than 1,500 lines-of-code was quite common. A single source-file with this many lines-of-code is sometimes known as a "God Class" because it is capable of doing too many different things. Every time I encountered one of these files, I found myself wishing there was a way to quickly get a high-level understanding of the public API of the Class, as well as a rough understanding of its internal implementation. I hoped that this would help me make changes with confidence, and maybe even do a bit of refactoring to extract some parts of the code to a different well-defined module.
I ended-up building "AST Scout"[1] (github), a tool that can analyze a Javascript\Typescript Class\Module and visualize the relationship between its public API and its implementation details (e.g. private methods, dependencies used). This post explains how to use "AST Scout" and how it can help spot areas of low cohesion. It also covers how "AST Scout" is built, as well as what are its shortcomings and how it can be improved in the future.
Hello AST Scout 👋
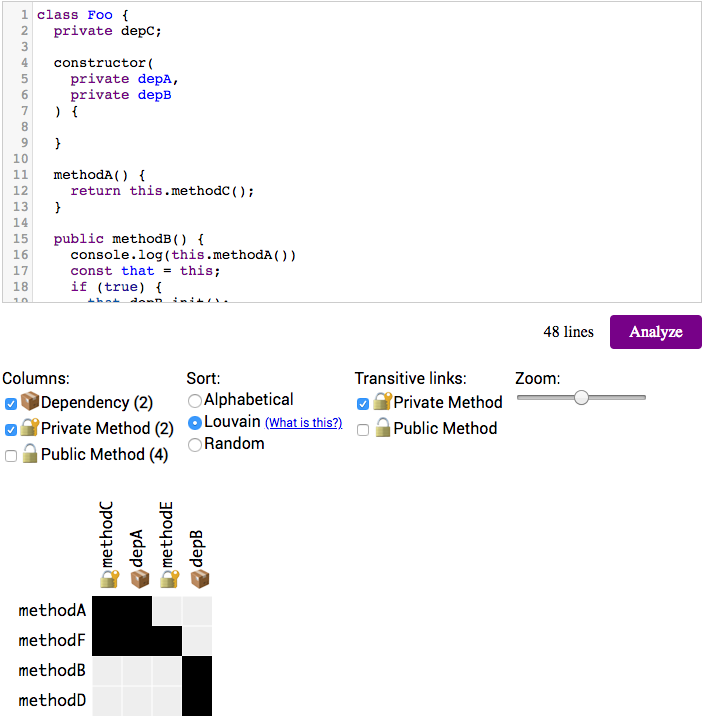
To start using "AST Scout" all you need to do is paste an ES6 Class or an ES6 Module, then click "Analyze." You'll see the results in a 2D Matrix:
Interpreting the results 🧐
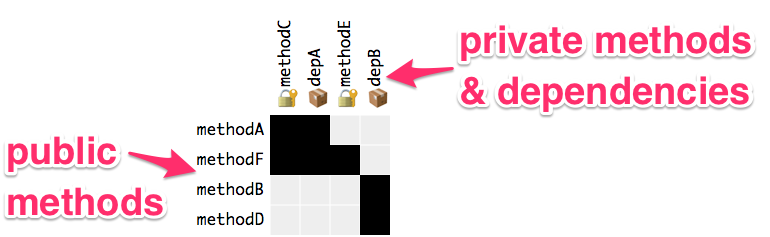
To explain how to read the output, let's focus on this example matrix:
This is called an Adjacency Matrix. A few things to note about this diagram:
- The rows represent the public API of the Class\Module.
These would be the public methods of a Class or the exported functions of a Module. - The columns represent the internal implementations details of the Class\Module. These would be:
- 🔐 Private methods of a Class or non-exported functions of a Module.
- 📦 Dependencies on other Classes\Modules. Class Constructor parameters are assumed to be dependencies injected by an IoC mechanism (Angular 1.x style). Imported modules are considered dependencies for Modules.
So in the example above we can see that the public API of this Class is composed of four public methods: methodA, methodF, methodB, and methodD.
The "internal implementation" consists of private methods methodC and methodE and a dependency on external Classes depA and depB.
Based on the black squares in the matrix, we can see that:
methodAis dependent onmethodC, anddepAmethodFis dependent onmethodC,depA, andmethodEmethodBis dependent ondepBmethodDis dependent ondepB
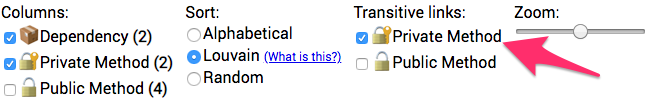
Notice that in order to provide an accurate representation of the structure of real-world complex code, "AST Scout" follows private methods as transitive links. For example, even though depA is not used directly in the source of methodA, it is marked as used by it because methodA uses methodC and methodC does use depA.
You can turn off this default behavior by unchecking "Private Method" as "Transitive links" in the controls:
So why is this useful? 🤷
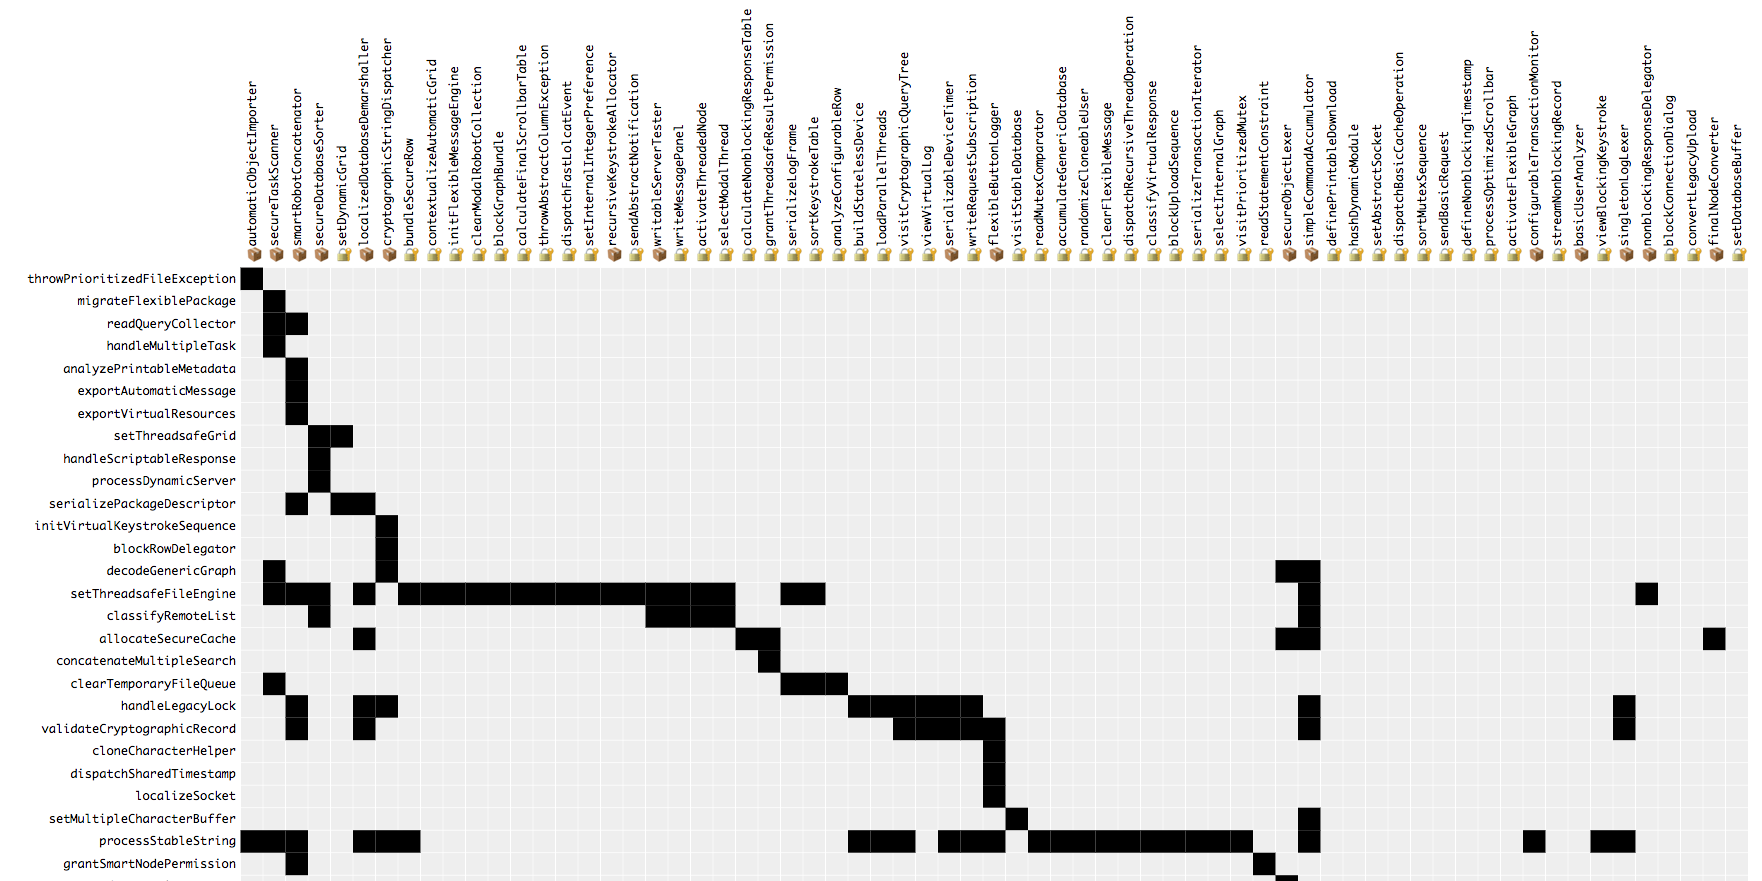
Obviously for a tiny Class file with only 38 lines-of-code and only 4 public methods, we don't need any analysis tool. But here's the output for a real Class file with 2,058 lines-of-code (with altered names) and 81 public methods (!):

If there are many black squares in the same column for many different rows it means that all those public methods rely on that same private method\dependency, which is indicative of high cohesion.
Contrarily, if there is a column that contains only one black square for a single row, then that private method\dependency is only used by that public method. More so, if a row contains no black squares, then that public method doesn't depend on any private method\dependency. Cases like these could be indicative of low cohesion, and might represent a good refactoring opportunity.
How does it work? 👷
In terms of analyzing the source code, I was pleasantly surprised to learn that the Typescript compiler API can run directly in the browser. In fact, if you implement a custom Typescript Language Service (as done here), then it can even perform "Find References" on a Symbol. This ability is crucial because "AST Scout" must be able to track references to figure out what uses each private method\dependency.
Overall, this allowed me to write "AST Scout" as a completely static site with no need for a server.
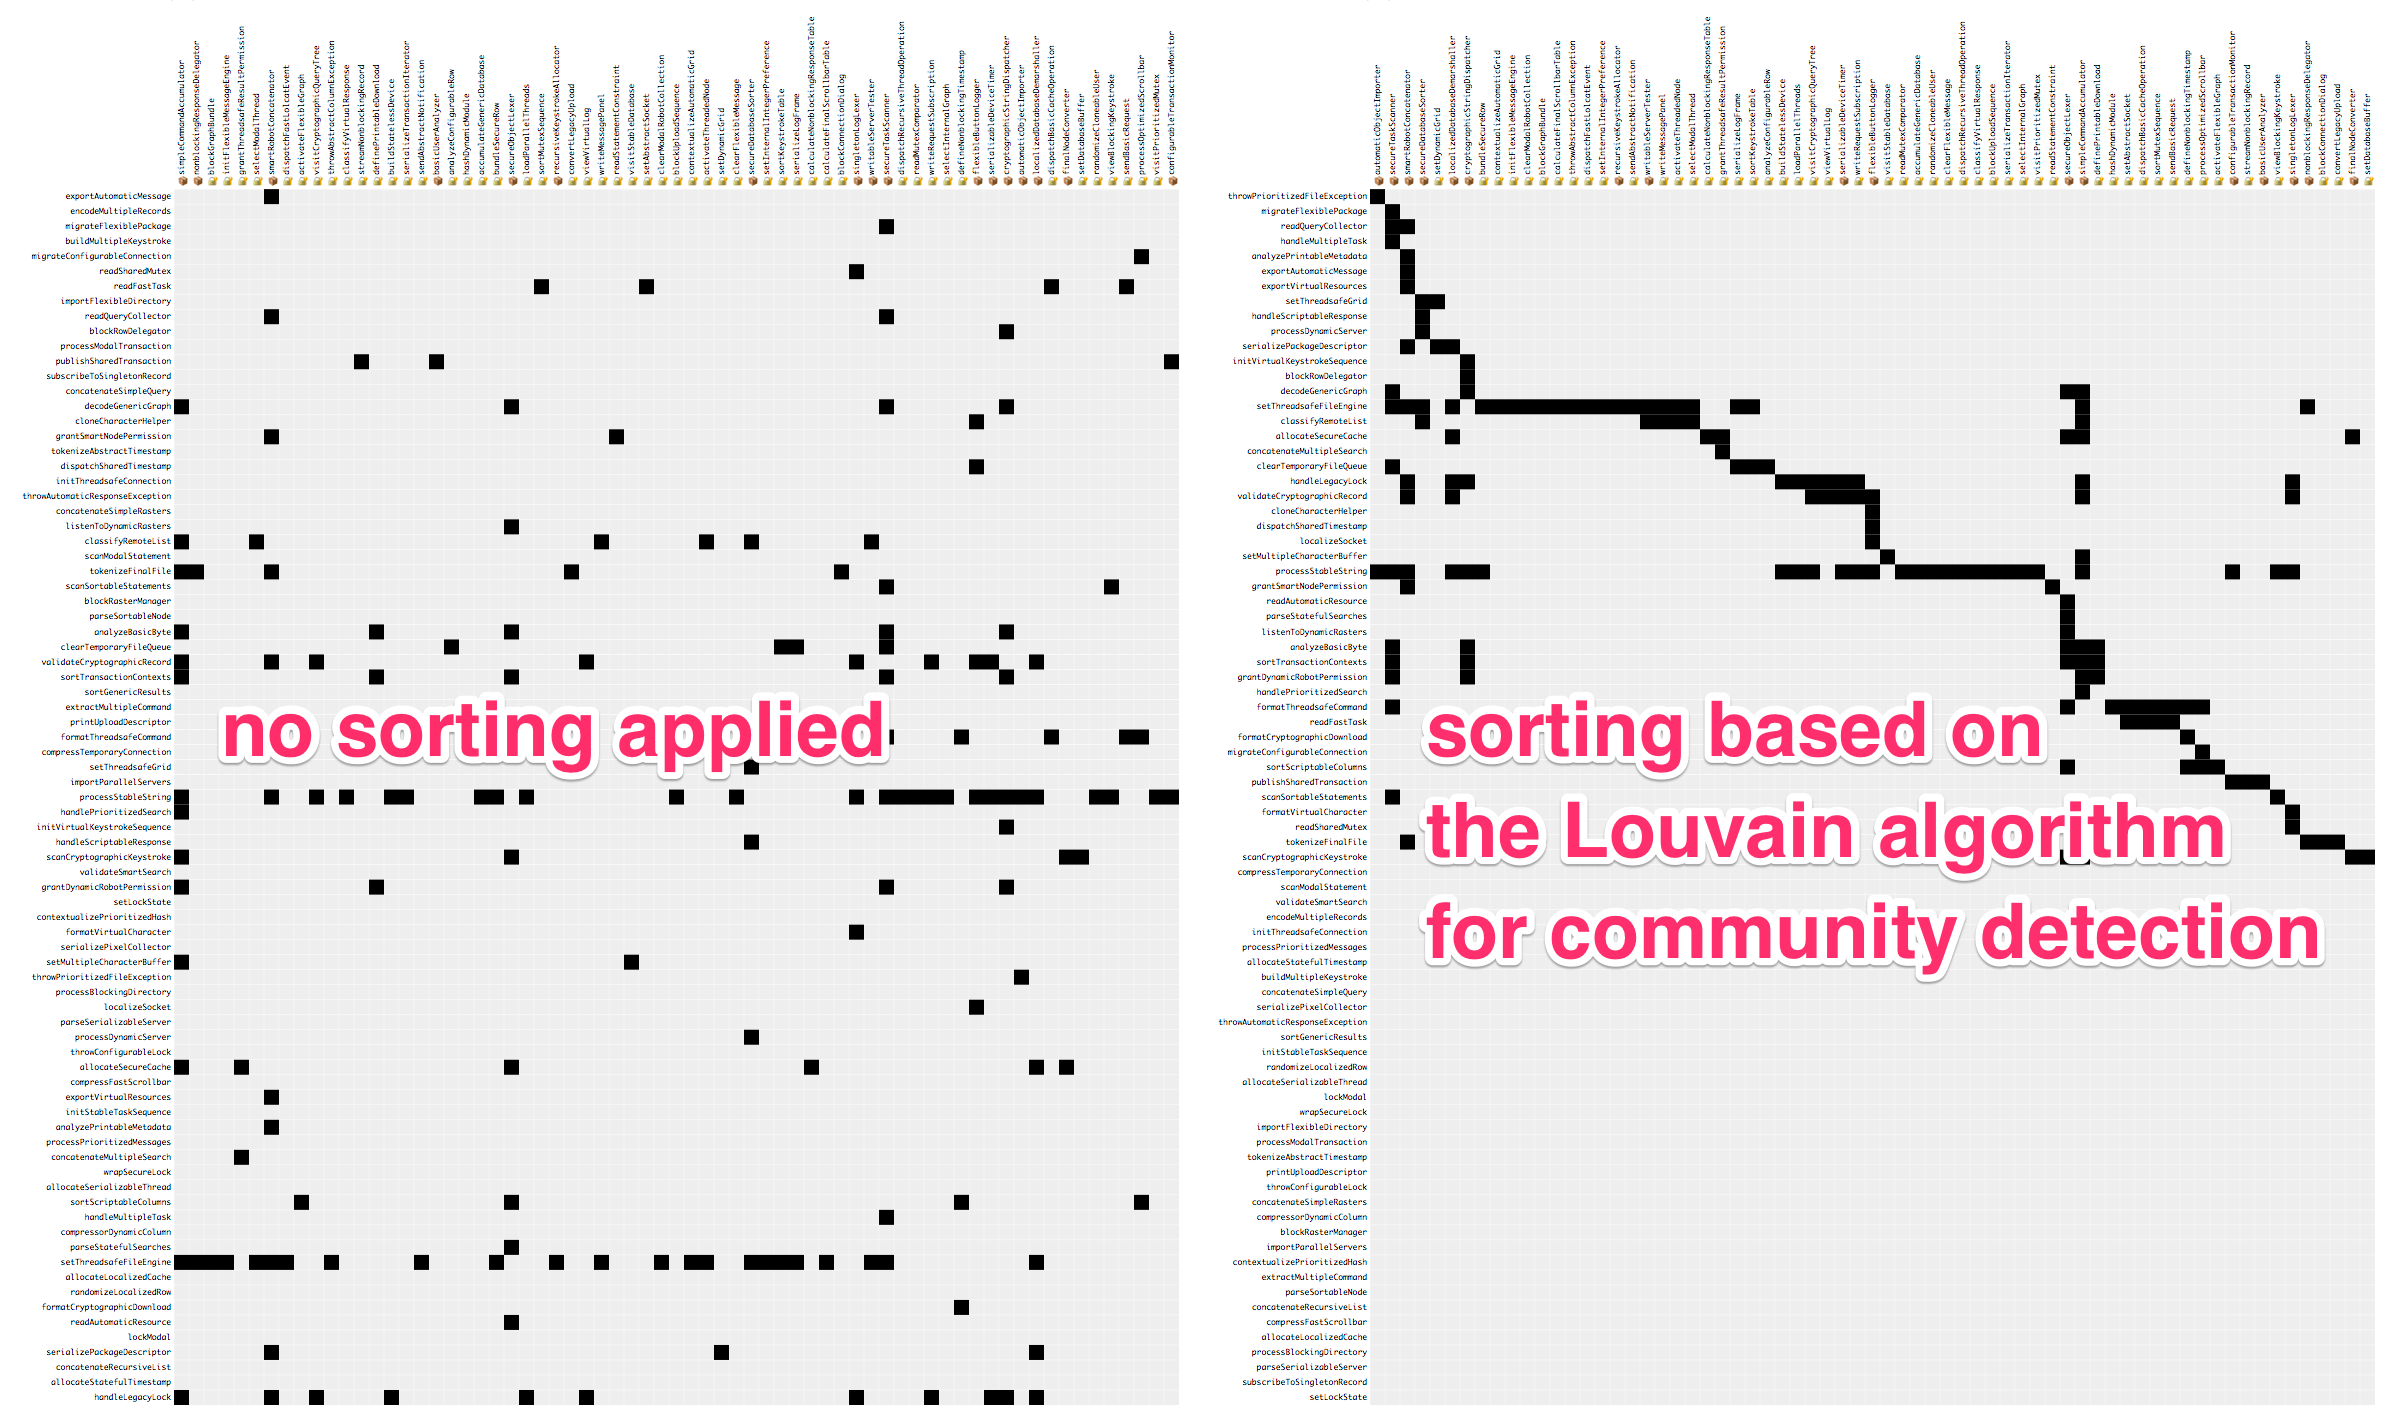
In terms of the visualization, I've tried a few different options before settling on using an Adjacency Matrix, but to my surprise my generated matrix looked nothing like the polished examples I was inspired by. I then realized that the key to generating a meaningful matrix is to set the order the rows and columns in a meaningful way. After some much needed guidance[2], I learned of an algorithm "for community detection" called the "Louvain Method" that can be applied to perform this sort.
Here are the results before and after applying this algorithm:
And here is a simplified example of how it's done in code:
(or check out the real implementation)
import { jLouvain } from 'louvain';

// Assuming that after analyzing the code we've concluded
// that this should be the structure of the matrix
const rows = [ "methodA", "methodB", "methodD", "methodF" ];
const columns = [ "methodC", "depA", "depB", "methodE" ];
const links = [
  { row: "methodA", column: "methodC" },
  { row: "methodA", column: "depA" },
  { row: "methodB", column: "depB" },
  { row: "methodD", column: "depB" },
  { row: "methodF", column: "methodE" },
  { row: "methodF", column: "methodC" },
  { row: "methodF", column: "depA" }
];

// Then in order to use Louvain to sort, we first convert
// the data into a graph data structure representation
const nodes = rows.concat(columns);
const edges = links.map(x => ({ source: x.row, target: x.column, value: 1 }));

// Then we apply Louvain which gives us
// a modularity score for each node
const community = jLouvain().nodes(nodes).edges(edges);
const scores = community();

// Which we can use to sort the rows and columns
rows.sort((a, b) => scores[a] - scores[b]);
columns.sort((a, b) => scores[a] - scores[b]);
Room for improvement 🔧
My underlying assumption before starting this project was that if you look within a single source file and apply the right analysis, you'll gain insights into how to split it up. Once the tool was built I was able to test this by trying it on a few "God Classes" from the aforementioned codebase. In some cases it gave hints on how to refactor the code, but in some it just solidified the fact that the code is a mess without leading the way out of it. Ultimately I think this approach of looking internally in the file for clues has its limits. The Interface Segregation Principle (ISP) might suggest a different external-based approach which could yield better results[3]. According to the ISP, one "smell" that hints at how to split up an interface is if some consumers of that interface use a completely different set of its methods than its other consumers. Similarly, "AST Scout" could scan your entire codebase to see how a particular Class is used, and would analyze\visualize that to help you identify split-points[4].
Try it for yourself 👩🔬
Hopefully you find this concept interesting and would like to try to use this tool to visualize some parts of your codebase. There's a live demo here, and the code is available here. I'd love to get feedback or discuss this idea, so feel free to reach out to me via twitter.
It's named "AST Scout" because at its core it's a tool for analyzing the Abstract Syntax Tree of a given piece of code just like the fantastic AST Explorer, and also because it can help apply the "Scout Rule". ↩︎
Thanks to Douglas Duhaime for pointing me in the right direction. ↩︎
Thanks to Avish for discussing this issue with me and giving me feedback. ↩︎
It means "AST Scout" won't be able to stay a Web-based tool where you paste the source of the single file you want to analyze. It would instead need to be a CLI tool or an IDE extension that has access to the entire codebase. ↩︎